We’re in the middle of the 2020 Census, which is mandated by the U.S. Constitution to count every person in the United States and five U.S. territories. The census provides data that lawmakers at all levels of government use to help allocate funding for important services and infrastructure like public health, schools, roads, police and fire protection.
The census is also used by businesses, entrepreneurs, economic development leaders, marketers, communicators and journalists to understand communities, impending changes and opportunities for growth.

At MP&F, we use myriad census data sets to help our clients spot opportunities and tackle business challenges. We also use census data to help add context to story pitches and provide perspective to the news media.
While census information is public record and our clients could access it themselves, there is an overwhelming amount of it. Many businesses find it more cost effective and efficient to hire a marketing agency or consultant to analyze data when they have business opportunities to explore or questions to answer. Moreover, outside data marketing teams typically have software and access to other data sets that can be valuable in providing context to census data.
If you think you might need some assistance in this regard, please contact us. But if you want to give it a shot yourself, we’ve compiled a list of data sets that are potentially helpful through a marketing or communications lens.
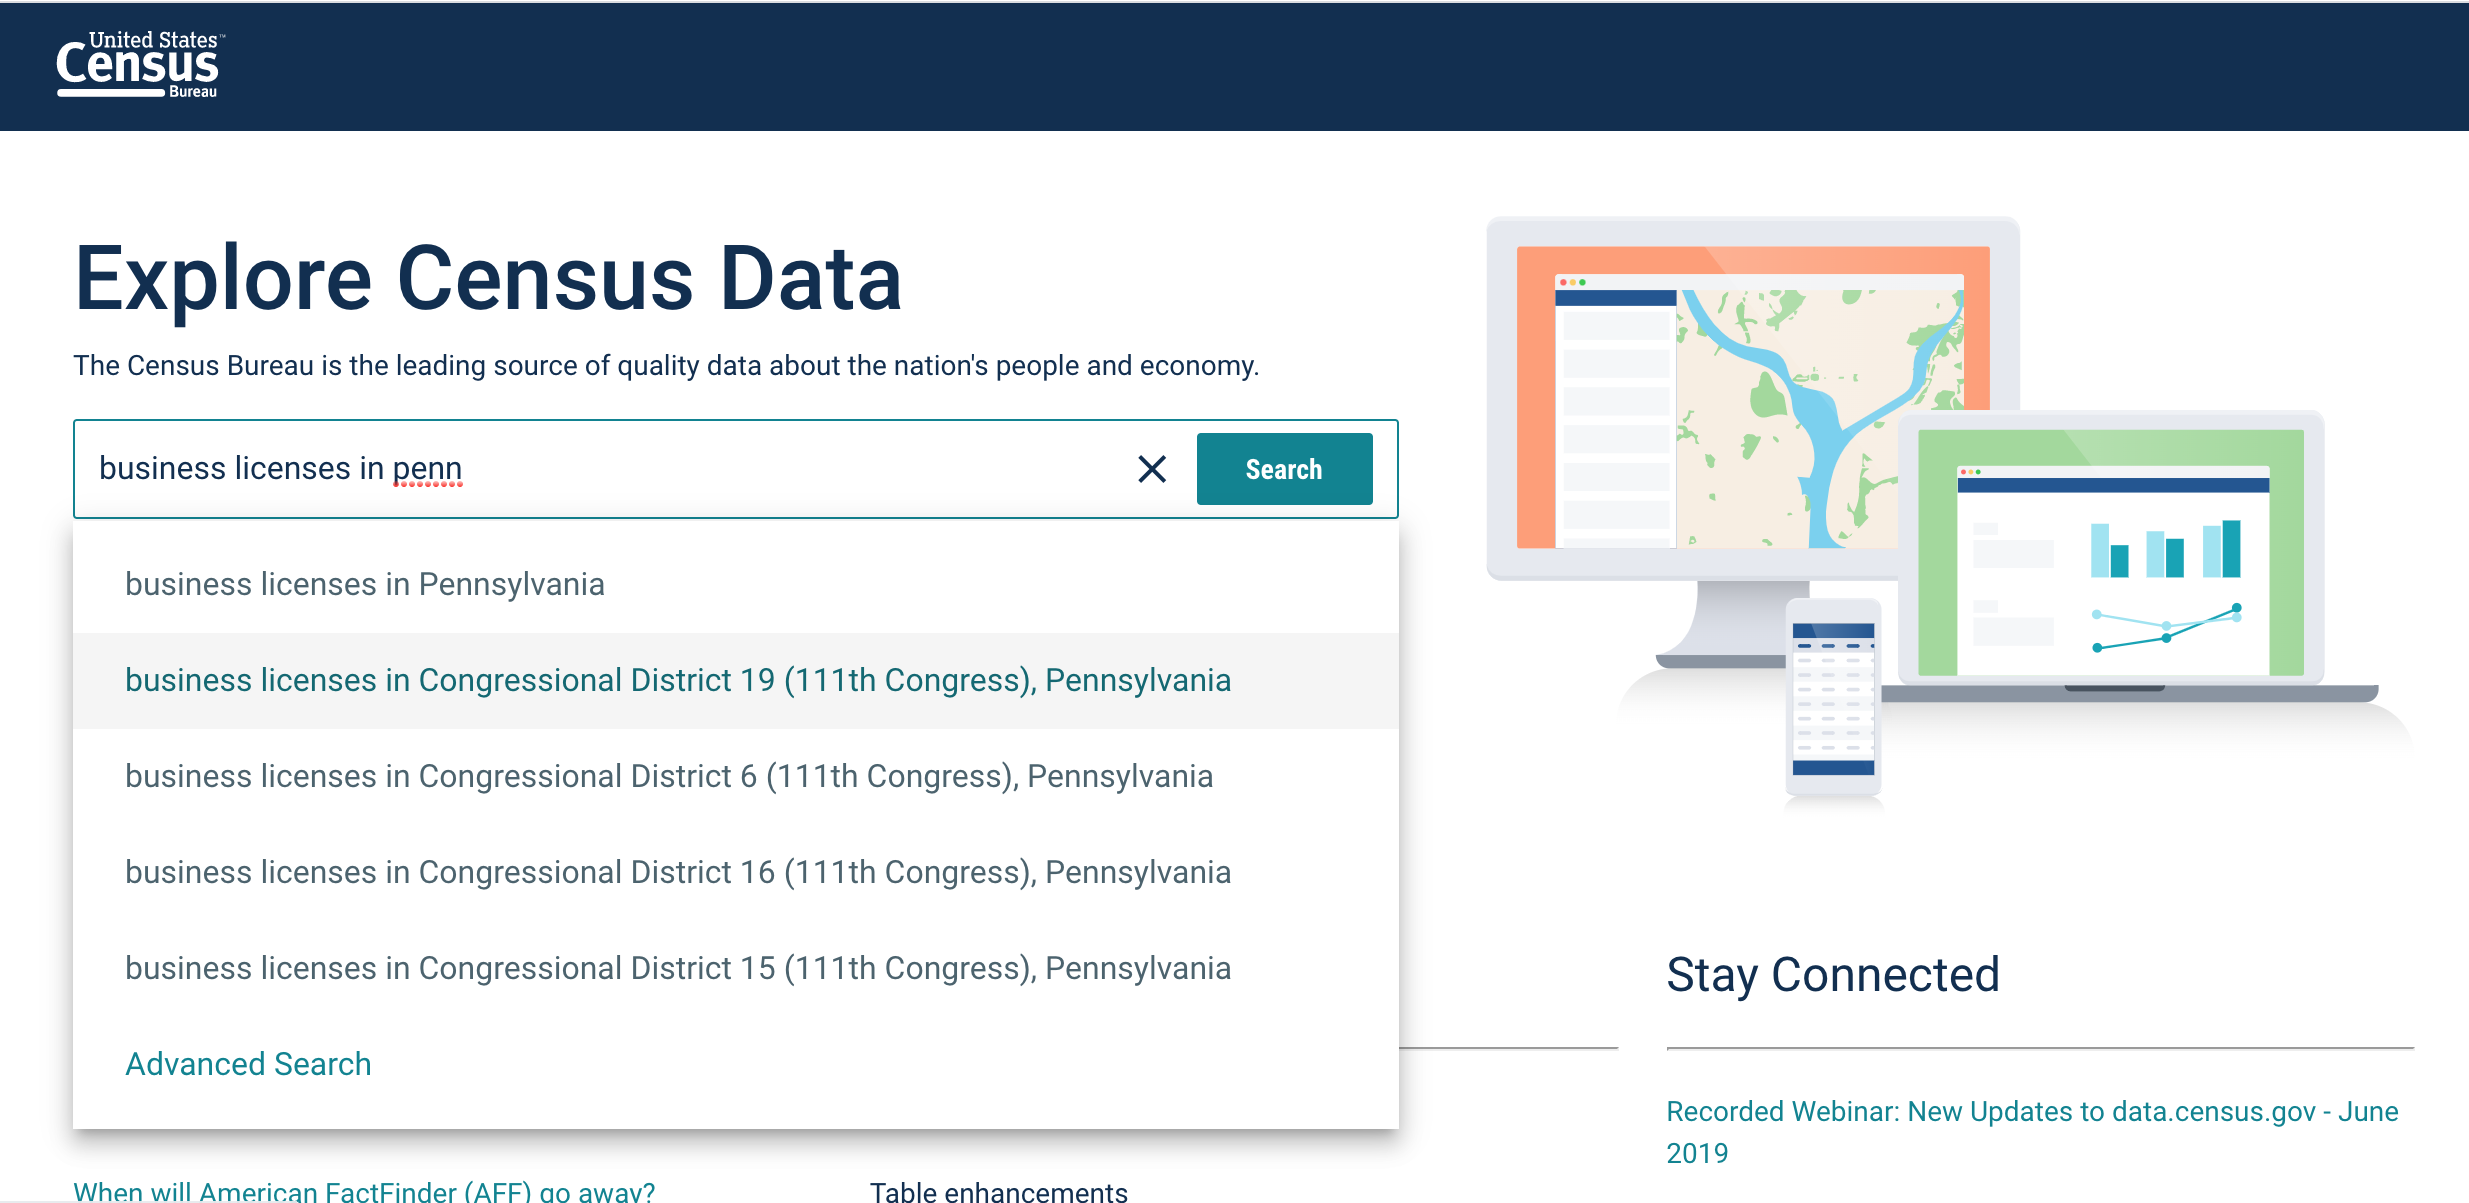
Data.Census.gov

The U.S. Census maintains a sizable amount of information in searchable, cross-tabulated charts and downloadable tables organized by high-level categories like education, health, housing, race, income and families.
Most of this information has been organized at a microsite, Data.Census.gov, which was previously called American FactFinder.
Data is not limited to the large, 10-year collections like the 2020 Census — but those are included, of course.
You can get very granular data sets within each of these broad categories. For example, the chart below shows the top-level view of educational attainment by age, gender, race, poverty rate and median earnings for Tennesseans in 2018. By downloading this data, you can also see this information at a county level, as well as over a five-year range.
You can download the information in a CSV file, which will allow you to open it and compare and contrast it in Excel, Access or BI software with other interest data. (You also have the option of downloading in a PDF format.)
New residential construction
The Census Bureau also maintains hundreds of other data sets — including economic indicators used by businesses and local governments to understand opportunities and conditions.
We’ll discuss two that are commonly cited in economic reports, starting with new residential construction.
The census maintains information about new housing starts authorized by building permits issued at a state, county and local level. Depending on the level, building permits are updated on census databases as often as once a quarter. The more local the level, the more challenging it can be to locate building permits this way.
You can analyze by geography and time, or download tables and compare with other data sets. Here’s the link to get started.
Manufacturing shipments
Here, you can find monthly statistics illustrating the domestic manufacturing sector. This information provides an indication of current trends as well as future economic outlook. You can view statistics for filled versus unfilled orders to get a feel for economic dips. You can also filter out defense versus non-defense on segments such as aircraft manufacturing when government projects are likely to skew private-sector trends.
For the most part, you will have to make sense of the data yourself when it comes to manufacturing data. Unlike many other census data sets, manufacturing information is relatively raw and — for the most part — must be downloaded into an Excel file for analysis. Here’s a link to get started.